3.1 Control Plane vs Agent Execution Plane
3.2 Project Scope Model
3.3 Data Flow: Source -> Release -> Pipeline -> Logs/Artifacts
3.4 Runtime Configuration Layers (global / project / environment)
3.5 Pipeline Execution Semantics
3.6 Release Governance Path
3.7 Rollback Architecture (Policy-driven)
3.8 Security and Trust Boundaries
3.9 State and Persistence Model
3.10 Scalability Model
3.11 Failure Modes and Recovery Patterns
3.12 Why This Architecture Works in Practice
15.1 Live Console Features
Orbnetes deployment and release orchestration documentation for operators and platform teams.
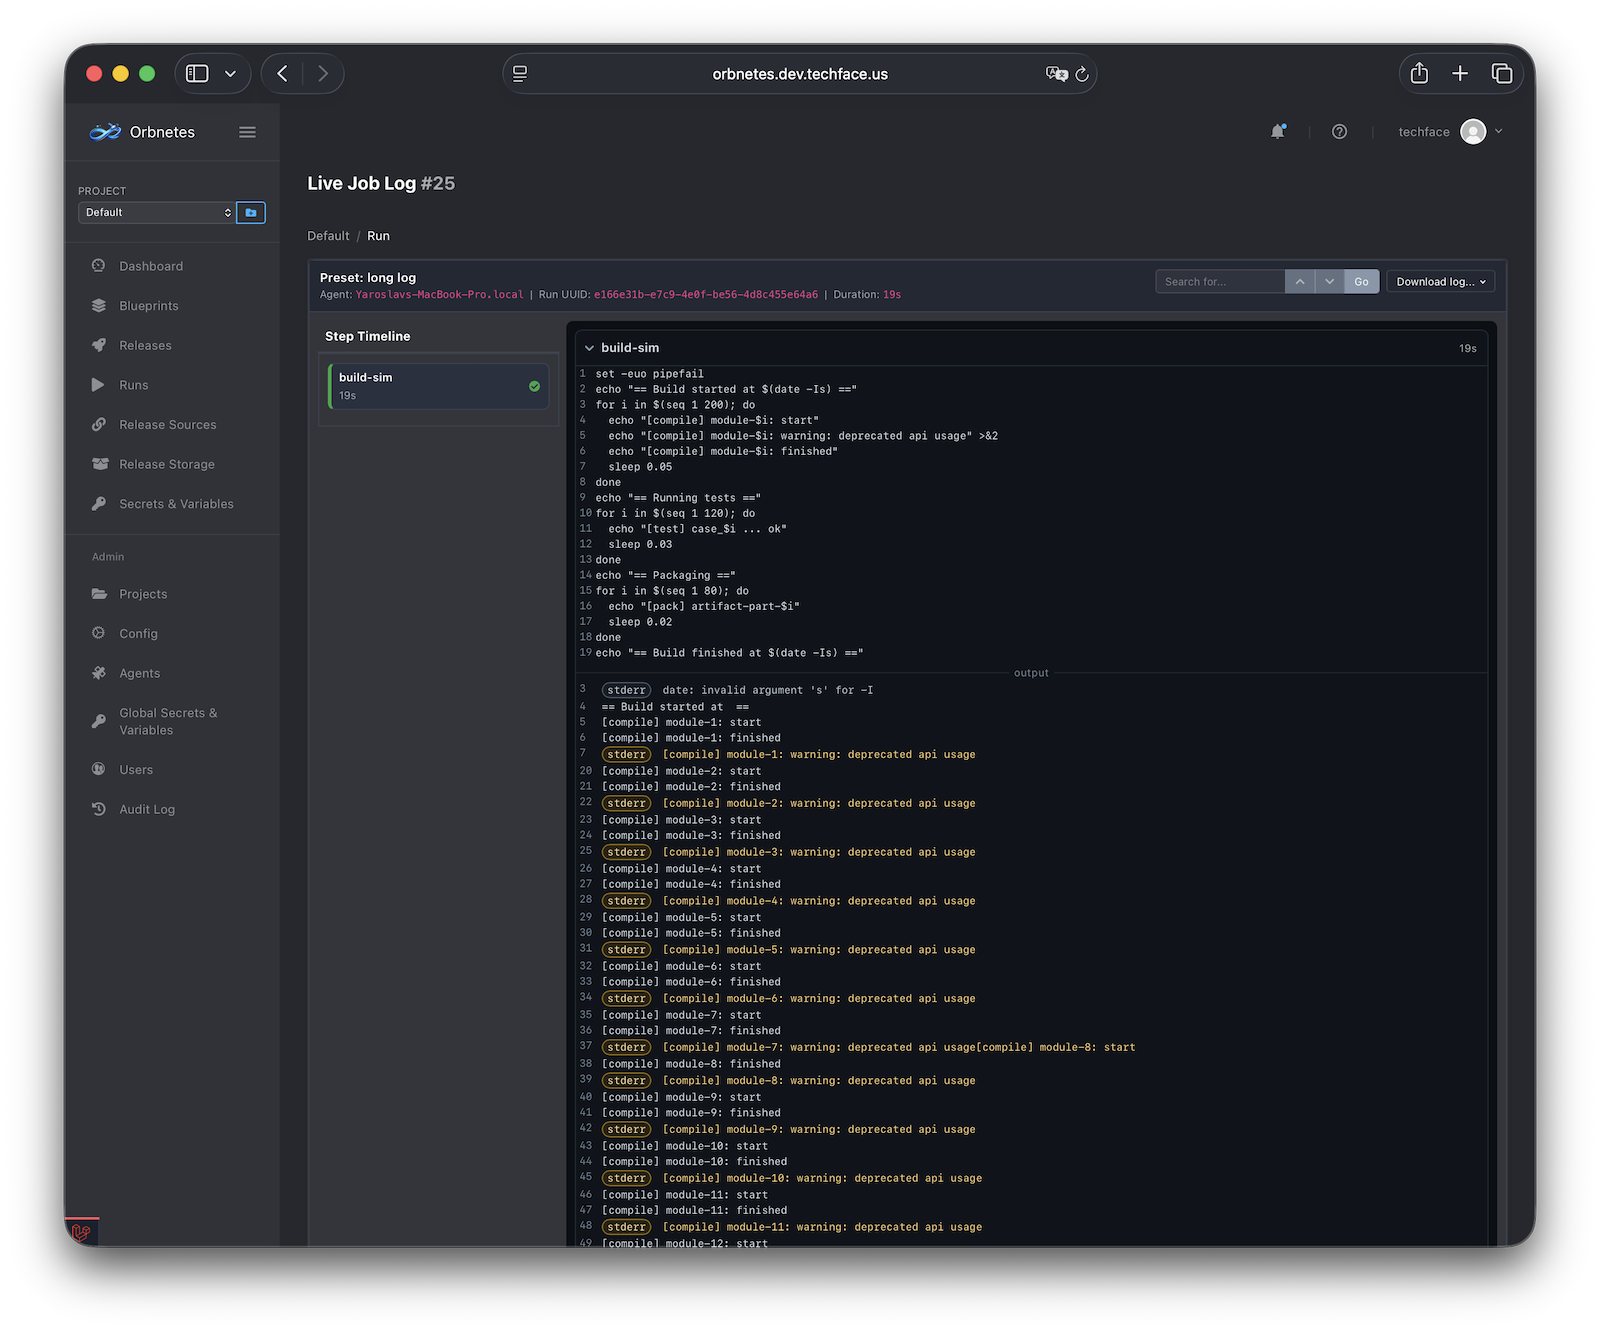
This section explains how Orbnetes provides runtime visibility during and after execution. The goal is not only to see that a run failed, but to understand where, why, and what to do next quickly.
Observability stack in Orbnetes combines:
- pipeline-level graph status,
- job-level live console,
- step timeline,
- status/duration metadata,
- downloadable execution logs.
The Live Console is the primary runtime debugging surface for a job run.
Core capabilities:
- real-time log streaming while step is running,
- per-step log segmentation,
- line numbering and deep links,
- shell command context and output context,
- live status updates (queued/running/succeeded/failed/canceled).
Why this matters:
- operators can diagnose failures before whole pipeline completes,
- incident response starts immediately, not after timeout/final state,
- you can correlate command intent with observed output in one view.
Operator workflow:
- open failed/running job page from pipeline graph,
- expand active step,
- inspect first error-producing lines,
- validate whether issue is configuration, infra, or command-level logic.
Practical tip: focus on first meaningful error in timeline order, not the final summary line.