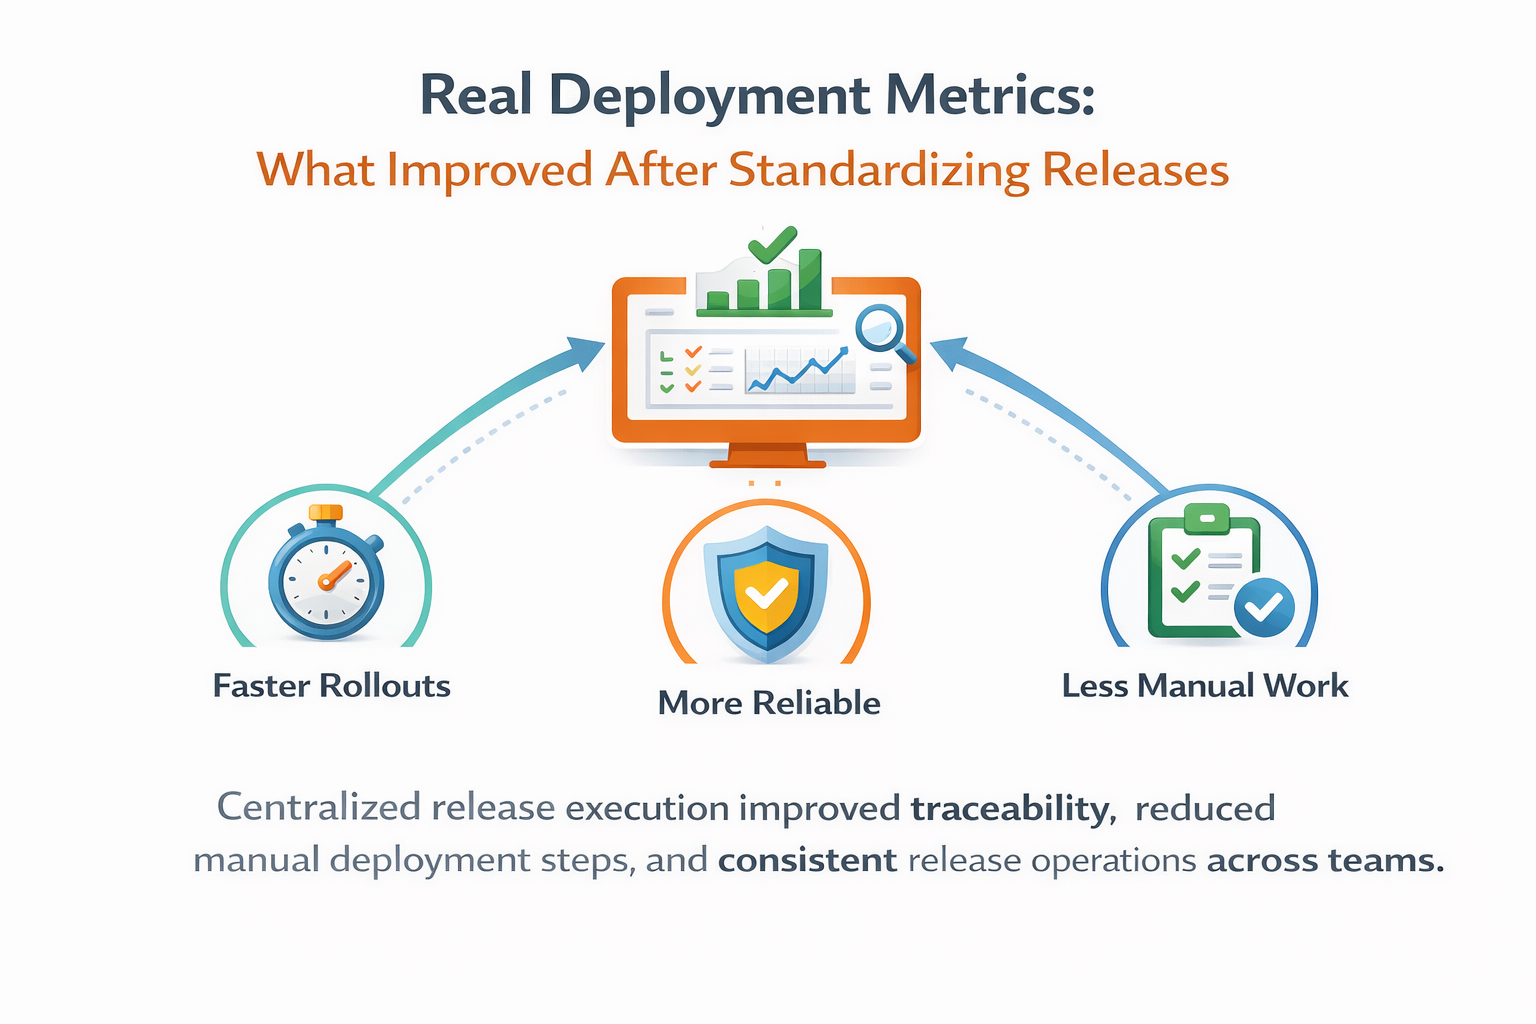
Measured impact of standardized release orchestration on failure rate, lead time, traceability, and operational consistency across teams.
When teams say "our deployments are improving," they usually rely on intuition. We had the same issue. Different services used different deploy paths, so metrics were inconsistent and hard to compare. One team counted release start at CI trigger, another at script execution, and another at first host restart.
To make metrics actionable, we standardized execution on release-driven flows. Every deployment now starts from the same object model: source selection, blueprint binding, environment targets, runtime inputs, and governed execution. This gave us common lifecycle states across services and environments.
The first measurable improvement was visibility. We could finally track queue time, approval wait, execution duration, and terminal outcome under one schema. That sounds basic, but without a shared model these signals were previously scattered across CI logs, chat messages, and host history.

The second improvement was data quality for incident analysis. Because job-level logs, pipeline graph states, and release metadata were linked, we could distinguish three different bottlenecks that used to be conflated: routing delays (no matching agent), configuration errors (missing scoped values), and runtime command failures.
Standardization also reduced manual variance in deployment steps. Before, operators often adjusted commands during rollout based on environment habits. After moving to reusable blueprints, those differences became explicit jobs or inputs instead of undocumented human decisions.
Over time, this lowered "silent change" risk. When release behavior changed, it changed in versioned blueprint definitions reviewed by the team. That made operational changes discoverable and auditable, rather than hidden in ad-hoc terminal history.
{
  "release_lead_time_minutes": 34,
  "failure_rate_first_run": 0.11,
  "rerun_failed_ratio": 0.19,
  "rollback_ratio": 0.04,
  "mttri_minutes": 9
}
One of the strongest outcomes was comparability across teams. We introduced a small set of shared metrics: release lead time, failure rate on first execution, rerun ratio, rollback ratio, and median time to first causal error identification. Teams could benchmark improvements using the same definitions.
The rerun ratio became particularly useful. High rerun rates highlighted unstable steps or brittle external dependencies even when terminal release status was eventually successful. This gave us a reliability signal beyond pass/fail and helped prioritize operational hardening work.
We also observed better handoffs between development and operations. Release pages carried the full context needed for support: selected version, inputs, environment, approvals, and logs. Fewer back-and-forth messages were needed to reconstruct what happened.
An unexpected benefit was onboarding speed. New engineers could follow one consistent deployment model instead of learning team-specific scripts. This reduced the learning curve and decreased accidental mistakes during early operational tasks.
After one quarter with standardized release execution, we saw clear directional improvements: lower manual step count per production rollout, faster triage during failures, and fewer inconsistent outcomes between environments. Not every metric changed equally, but every team gained a clearer baseline.

The key lesson is that reliability metrics become useful only when execution semantics are consistent. Standardization does not remove complexity; it makes complexity measurable. Once measurable, you can improve it intentionally instead of reacting to isolated incidents.
Key takeaways
- Unified release lifecycle created consistent operational metrics.
- Manual deployment steps were replaced by reusable blueprints.
- Cross-team visibility improved with shared status language.